Grafana
Observability and Visualization Platform
Grafana is an open-source platform for monitoring, observability, and visualization, empowering users to create rich, interactive dashboards for monitoring and analyzing time-series data. With its extensive support for various data sources, flexible visualization options, and advanced alerting capabilities, Grafana is widely used by organizations to gain insights into their systems, applications, and infrastructure.
Key Features
- Data Source Agnostic: Grafana supports a wide range of data sources, including Prometheus, Graphite, Elasticsearch, InfluxDB, and more, enabling unified monitoring and visualization of diverse data sets.
- Flexible Visualization: Create customized dashboards with a variety of visualization options, including graphs, gauges, heatmaps, and tables, to suit your specific monitoring needs.
- Alerting and Notification: Set up alerts based on predefined thresholds or conditions, and receive notifications via various channels, such as email, Slack, PagerDuty, and more, to stay informed about critical events.
- Templating and Annotations: Utilize templating and annotations to dynamically change dashboard variables and annotate events or anomalies, providing context and insights into your data.
- Community and Ecosystem: Grafana boasts a vibrant community and ecosystem of plugins, integrations, and dashboards contributed by users and developers worldwide, enhancing its functionality and extensibility.
Getting Started
To get started with Grafana, download and install the software from the official website, or deploy it using Docker or Kubernetes. The website offers comprehensive documentation, tutorials, and guides to help you set up and configure Grafana for your monitoring environment.
Community and Support
Join the Grafana community on the official forums to engage with other users, ask questions, share your dashboards, and contribute to the project. Stay informed about the latest updates, features, and best practices through community discussions and announcements.
Gain deeper insights into your data and systems with Grafana—a powerful and customizable observability platform for visualizing and monitoring your metrics, logs, and traces.
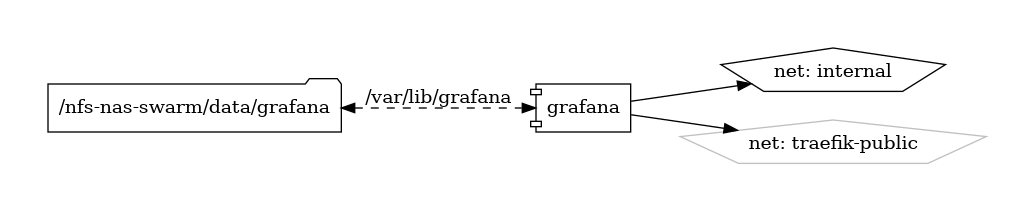
Volumes
Deployment
No Special requirments